Market Outlook
November 23, 2017
Market Cues
Domestic Indices
Chg (%)
(Pts)
(Close)
Indian markets are likely to open flat tracking global indices and SGX Nifty.
BSE Sensex
0.2
83
33,562
Nifty
0.1
15
10,342
U.S. markets mostly slipped away from their latest record highs Wednesday as the
two former halves of Hewlett-Packard both tumbled, while falling interest rates
Mid Cap
(0.1)
(9)
16,785
helped phone companies but hurt banks.
Small Cap
0.2
40
17,853
Bankex
(0.1)
(18)
29,189
The European markets ended Wednesday's session with mixed results. Trading
activity was choppy throughout the day, but most markets were up ahead of the
Global Indices
Chg (%)
(Pts)
(Close)
opening bell on Wall Street. Markets in Europe decline in late trade as the U.S.
markets struggled in early trade. The upcoming Thanksgiving holiday is keeping a
Dow Jones
(0.3)
65
23,526
number of U.S. investors away from their desks.
Nasdaq
0.01
5
6,868
FTSE
0.1
8
7,419
Indian markets rose modestly on Wednesday to extend gains for the fifth consecutive
Nikkei
0.5
107
22,523
session in the face of Moody's decision last week to upgrade India's sovereign rating
after a gap of 14 years.
Hang Seng
0.6
185
30,003
Shanghai Com
0.6
20
3,430
News Analysis
Maruti Suzuki may shift entire Swift production to Gujarat
Advances / Declines
BSE
NSE
Detailed analysis on Pg2
Advances
1,296
970
Declines
1,436
767
Investor’s Ready Reckoner
Unchanged
160
76
Key Domestic & Global Indicators
Stock Watch: Latest investment recommendations on 150+ stocks
Volumes (` Cr)
Refer Pg5 onwards
BSE
4,826
Top Picks
NSE
29,865
CMP
Target
Upside
Company
Sector
Rating
(`)
(`)
(%)
Blue Star
Capital Goods
Buy
685
867
26.6
Net Inflows (` Cr)
Net
Mtd
Ytd
Dewan Housing Finance
Financials
Accumulate
620
712
14.8
FII
289
14,403
52,855
Asian Granito
Other
Buy
489
570
16.5
MFs
2,326
3,825
99,236
Navkar Corporation
Other
Buy
189
265
40.6
KEI Industries
Capital Goods Accumulate
333
380
14.2
More Top Picks on Pg4
Top Gainers
Price (`)
Chg (%)
Fretail
574
11.7
Key Upcoming Events
Gppl
150
7.4
Previous
Consensus
Date
Region
Event Description
Reading
Expectations
Bfutilitie
524
6.4
Nov22
Germany PMI Services
54.70
55.00
Unitech
6
4.5
Nov22
Germany GDP nsa (YoY)
2.30
2.30
Prestige
321
4.2
Nov23
Germany PMI Manufacturing
60.60
60.40
Nov23
US
Consumer Confidence
125.90
124.00
Nov23
UK
GDP (YoY)
1.50
1.50
Top Losers
Price (`)
Chg (%)
More Events on Pg7
Videoind
13
(4.9)
Ibrealest
213
(4.5)
Gati
128
(3.7)
Fortis
125
(3.2)
Den
90
(2.9)
As on November, 22 2017
Market Outlook
November 23, 2017
News Analysis
Maruti Suzuki may shift entire Swift production to Gujarat
MSIL continues to see a huge demand for its new models. The new Dzire clocked
the sales volumes of 1 lack within the first five months of launch and has still has a
waiting period of about 17-18 months. We believe that company is expecting a
similar response to the upcoming launch of new Swift in January 2018 (~15,000
to 20,000 vehicles per month). In FY17, company clocked about 102% utilization
at its Gurgaon and Manesar plants, so there is clearly no headroom for
incremental addition. Meanwhile at its Gujarat facility, MSIL is currently assembling
10,500 vehicles a month and by 4th quarter, company expects to double this to
about 20,000 vehicles by adding a second shift. Considering that company has a
headroom at Gujarat plant, it would be rational to move some production to a
location where there is availability of capacity. We believe that this is a capacity
optimization exercise. We revise the target price to `9,489 on the stock assuming
that strong existing order book, incoming new demand of and ramp up of the
Gujarat facility. We maintain accumulate rating on the stock.
Y/E
Sales OPM
PAT
EPS ROE P/E P/BV
EV/EBITDA
March
(` cr)
(%)
(` cr)
(`)
(%)
(x)
(x)
(x)
FY2018E
80,827
15.6
8,508
281.7
21.7
30.2
6.6
18.2
FY2019E
96,636
16.9
10,986
363.8
22.8
23.4
5.3
13.6
Economic and Political News
India's solar capacity grew over 15% q-o-q in July-September period: Report
Indian companies to see better credit profiles in 2018, says Moody's
Electric vehicle fleet can create $300 bn domestic battery mkt: Niti report
Corporate News
Strides Shasun gets USFDA nod to market tablets for altitude
sickness
Adani close to securing Chinese loan for $16 bn Aussie coal project: Report
Crisil upgrades ratings on Tata Tele's bank loan facilities of `5,166cr
Market Outlook
November 23, 2017
Top Picks HHHHH
Market Cap
CMP
Target
Upside
Company
Rationale
(` Cr)
(`)
(`)
(%)
Strong growth in domestic business due to its leade`hip
in acute therapeutic segment. Alkem expects to launch
Alkem Laboratories
23,267
1,946
2,125
9.2
more products in USA, which bodes for its international
business.
We expect the company would report strong profitability
Asian Granito
1,472
489
570
16.5
owing to better product mix, higher B2C sales and
amalgamation synergy.
Favorable outlook for the AC industry to augur well for
Cooling products business which is out pacing the
Blue Star
6,564
685
867
26.6
market growth. EMPPAC division's profitability to
improve once operating environment turns around.
With a focus on the low and medium income (LMI)
consumer segment, the company has increased its
Dewan Housing Finance
19,456
620
712
14.8
presence in tier-II & III cities where the growth
opportunity is immense.
Loan growth is likely to pick up after a sluggish FY17.
Lower credit cost will help in strong bottom-line growth.
Karur Vysya Bank
7,324
121
180
48.5
Increasing share of CASA will help in NIM
improvement.
High order book execution in EPC segment, rising B2C
KEI Industries
2,607
333
380
14.2
sales and higher exports to boost the revenues and
profitability
Expected to benefit from the lower capex requirement
Music Broadcast
2,117
371
434
17.0
and 15 year long radio broadcast licensing.
Massive capacity expansion along with rail advantage
Navkar Corporation
2,837
189
265
40.6
at ICD as well CFS augur well for the company
Strong brands and distribution network would boost
Siyaram Silk Mills
2,707
578
650
12.5
growth going ahead. Stock currently trades at an
inexpensive valuation.
Market leadership in Hindi news genre and no.
2
viewership ranking in English news genre, exit from the
TV Today Network
2,238
375
435
15.9
radio business, and anticipated growth in ad spends by
corporate to benefit the stock.
After GST, the company is expected to see higher
volumes along with improving product mix. The Gujarat
Maruti Suzuki
2,57,200
8,514
9,489
11.4
plant will also enable higher operating leverage which
will be margin accretive.
We expect loan book to grow at 24.3% over next two
GIC Housing
2,288
425
655
54.1
year; change in borrowing mix will help in NIM
improvement..
Source: Company, Angel Research
Market Outlook
November 23, 2017
Key Upcoming Events
Global economic events release calendar
Bloomberg Data
Date
Time Country
Event Description
Unit
Period
Last Reported
Estimated
Nov 23, 2017
2:00 PMGermany
PMI Services
Value
Nov P
54.70
55.00
12:30 PMGermany
GDP nsa (YoY)
% Change
3Q F
2.30
2.30
2:00 PMGermany
PMI Manufacturing
Value
Nov P
60.60
60.40
8:30 PMUS
Consumer Confidence
S.A./ 1985=100
Nov
125.90
124.00
Nov 27, 2017
3:00 PMUK
GDP (YoY)
% Change
3Q P
1.50
1.50
Nov 28, 2017
8:30 PMUS
New home sales
Thousands
Oct
667.00
617.50
Nov 29, 2017
7:00 PMUS
GDP Qoq (Annualised)
% Change
3Q S
3.00
3.20
Nov 30, 2017
2:25 PMGermany
Unemployment change (000's)
Thousands
Nov
(11.00)
6:30 AMChina
PMI Manufacturing
Value
Nov
51.60
Dec 01, 2017
3:00 PMUK
PMI Manufacturing
Value
Nov
56.30
Dec 05, 2017
3:30 PMEuro Zone
Euro-Zone GDP s.a. (QoQ)
% Change
3Q F
0.60
Dec 06, 2017
2:30 PMIndia
RBI Reverse Repo rate
%
Dec 6
5.75
5.75
2:30 PMIndia
RBI Repo rate
%
Dec 6
6.00
6.00
2:30 PMIndia
RBI Cash Reserve ratio
%
Dec 6
4.00
4.00
Dec 08, 2017
3:00 PMUK
Industrial Production (YoY)
% Change
Oct
2.50
India
Exports YoY%
% Change
Nov
(1.10)
India
Imports YoY%
% Change
Nov
7.60
China
Exports YoY%
% Change
Nov
6.90
7:00 PMUS
Change in Nonfarm payrolls
Thousands
Nov
261.00
7:00 PMUS
Unnemployment rate
%
Nov
4.10
Dec 09, 2017
7:00 AMChina
Consumer Price Index (YoY)
% Change
Nov
1.90
Dec 12, 2017
5:30 PMIndia
Industrial Production YoY
% Change
Oct
3.80
3:00 PMUK
CPI (YoY)
% Change
Nov
3.00
US
Producer Price Index (mom)
% Change
Nov
0.20
Source: Bloomberg, Angel Research
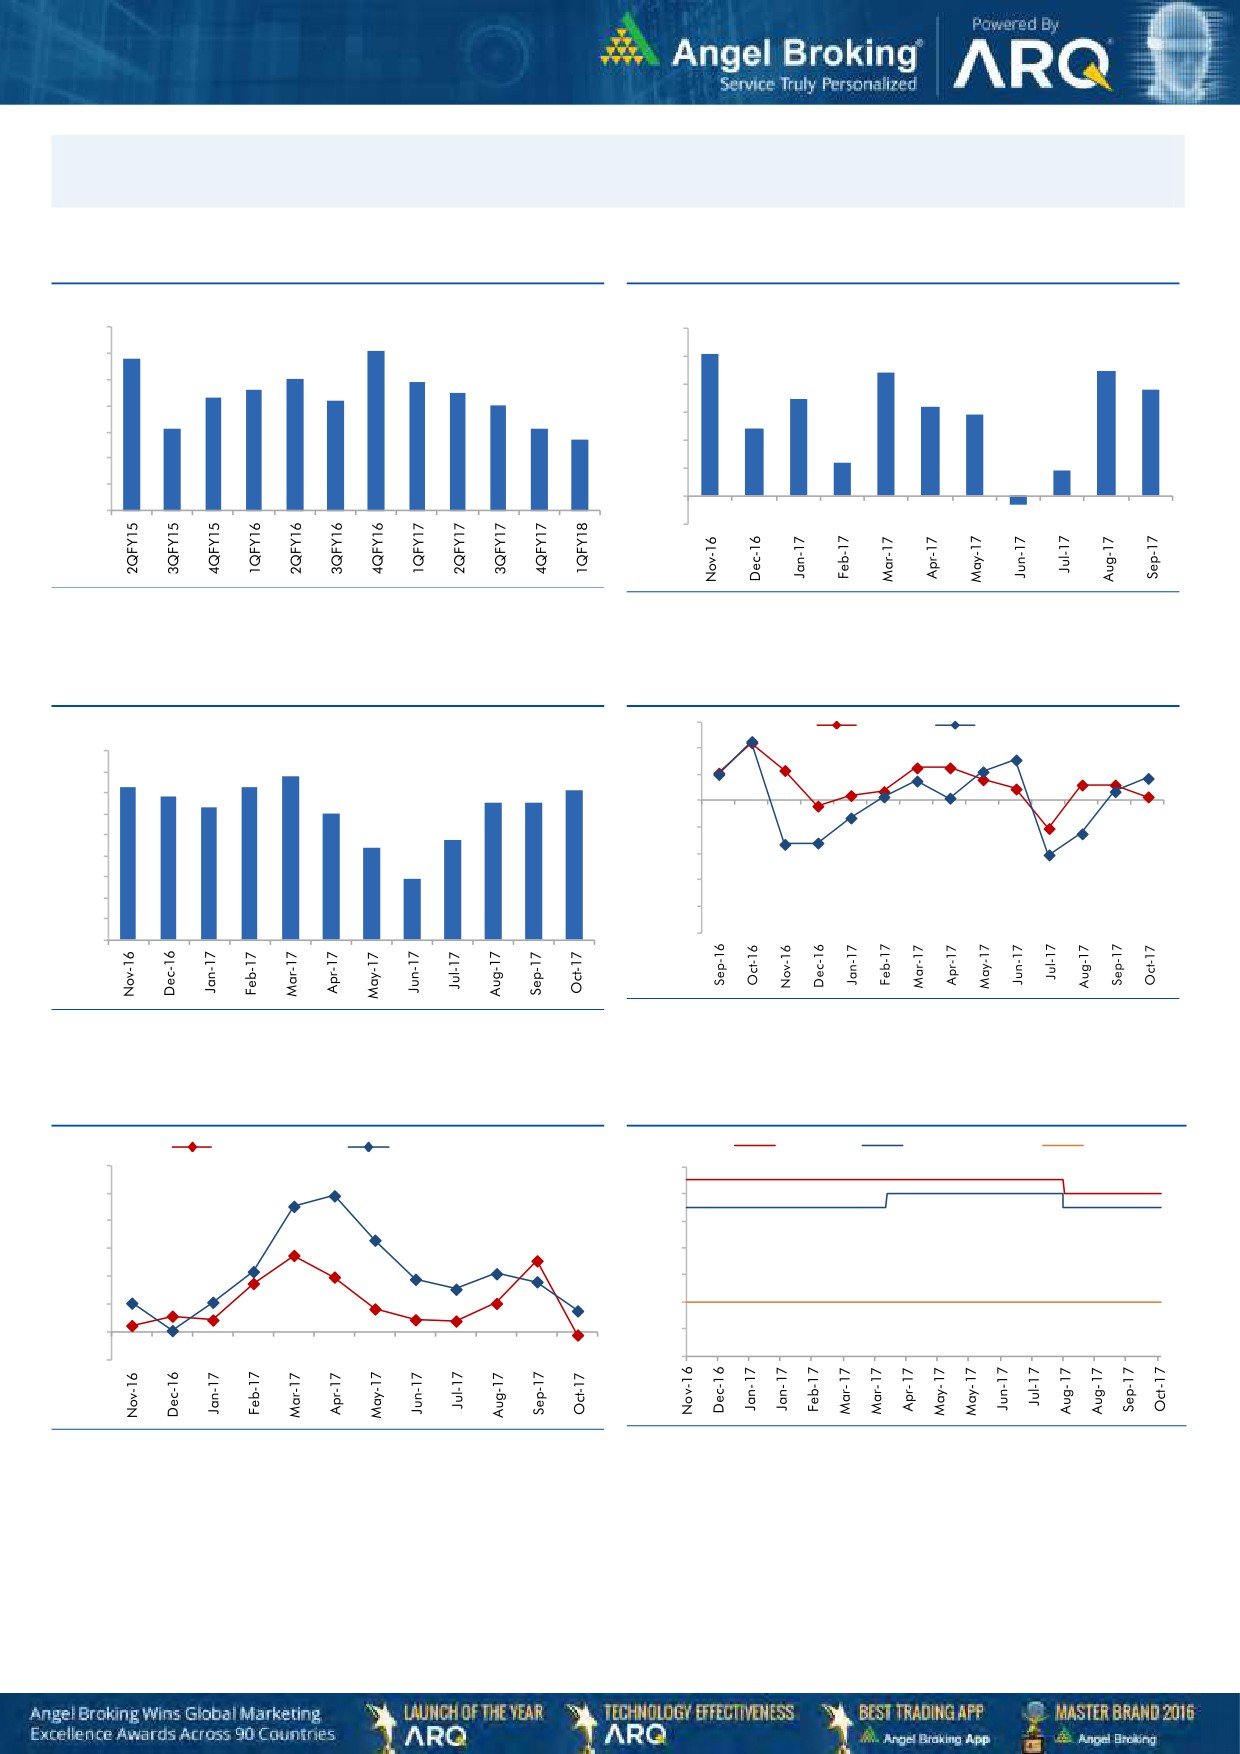
Market Outlook
November 23, 2017
Macro watch
Exhibit 1: Quarterly GDP trends
Exhibit 2: IIP trends
(%)
(%)
10.0
6.0
9.1
5.1
8.8
9.0
5.0
4.4
4.5
8.0
7.9
7.6
7.5
3.8
8.0
7.3
7.2
4.0
3.5
7.0
3.2
2.9
7.0
6.1
6.1
3.0
2.4
5.7
6.0
2.0
1.2
5.0
0.9
1.0
4.0
-
3.0
(1.0)
(0.3)
Source: CSO, Angel Research
Source: MOSPI, Angel Research
Exhibit 3: Monthly CPI inflation trends
Exhibit 4: Manufacturing and services PMI
56.0
Mfg. PMI
Services PMI
(%)
4.5
54.0
3.9
4.0
3.6
3.7
3.6
52.0
3.4
3.2
3.3
3.3
3.5
3.0
50.0
3.0
2.4
48.0
2.5
2.2
2.0
46.0
1.5
1.5
44.0
1.0
42.0
0.5
40.0
-
Source: Market, Angel Research; Note: Level above 50 indicates expansion
Source: MOSPI, Angel Research
Exhibit 5: Exports and imports growth trends
Exhibit 6: Key policy rates
(%)
Exports yoy growth
Imports yoy growth
(%)
Repo rate
Reverse Repo rate
CRR
60.0
6.50
50.0
6.00
40.0
5.50
30.0
5.00
20.0
4.50
10.0
4.00
0.0
3.50
(10.0)
3.00
Source: Bloomberg, Angel Research
Source: RBI, Angel Research
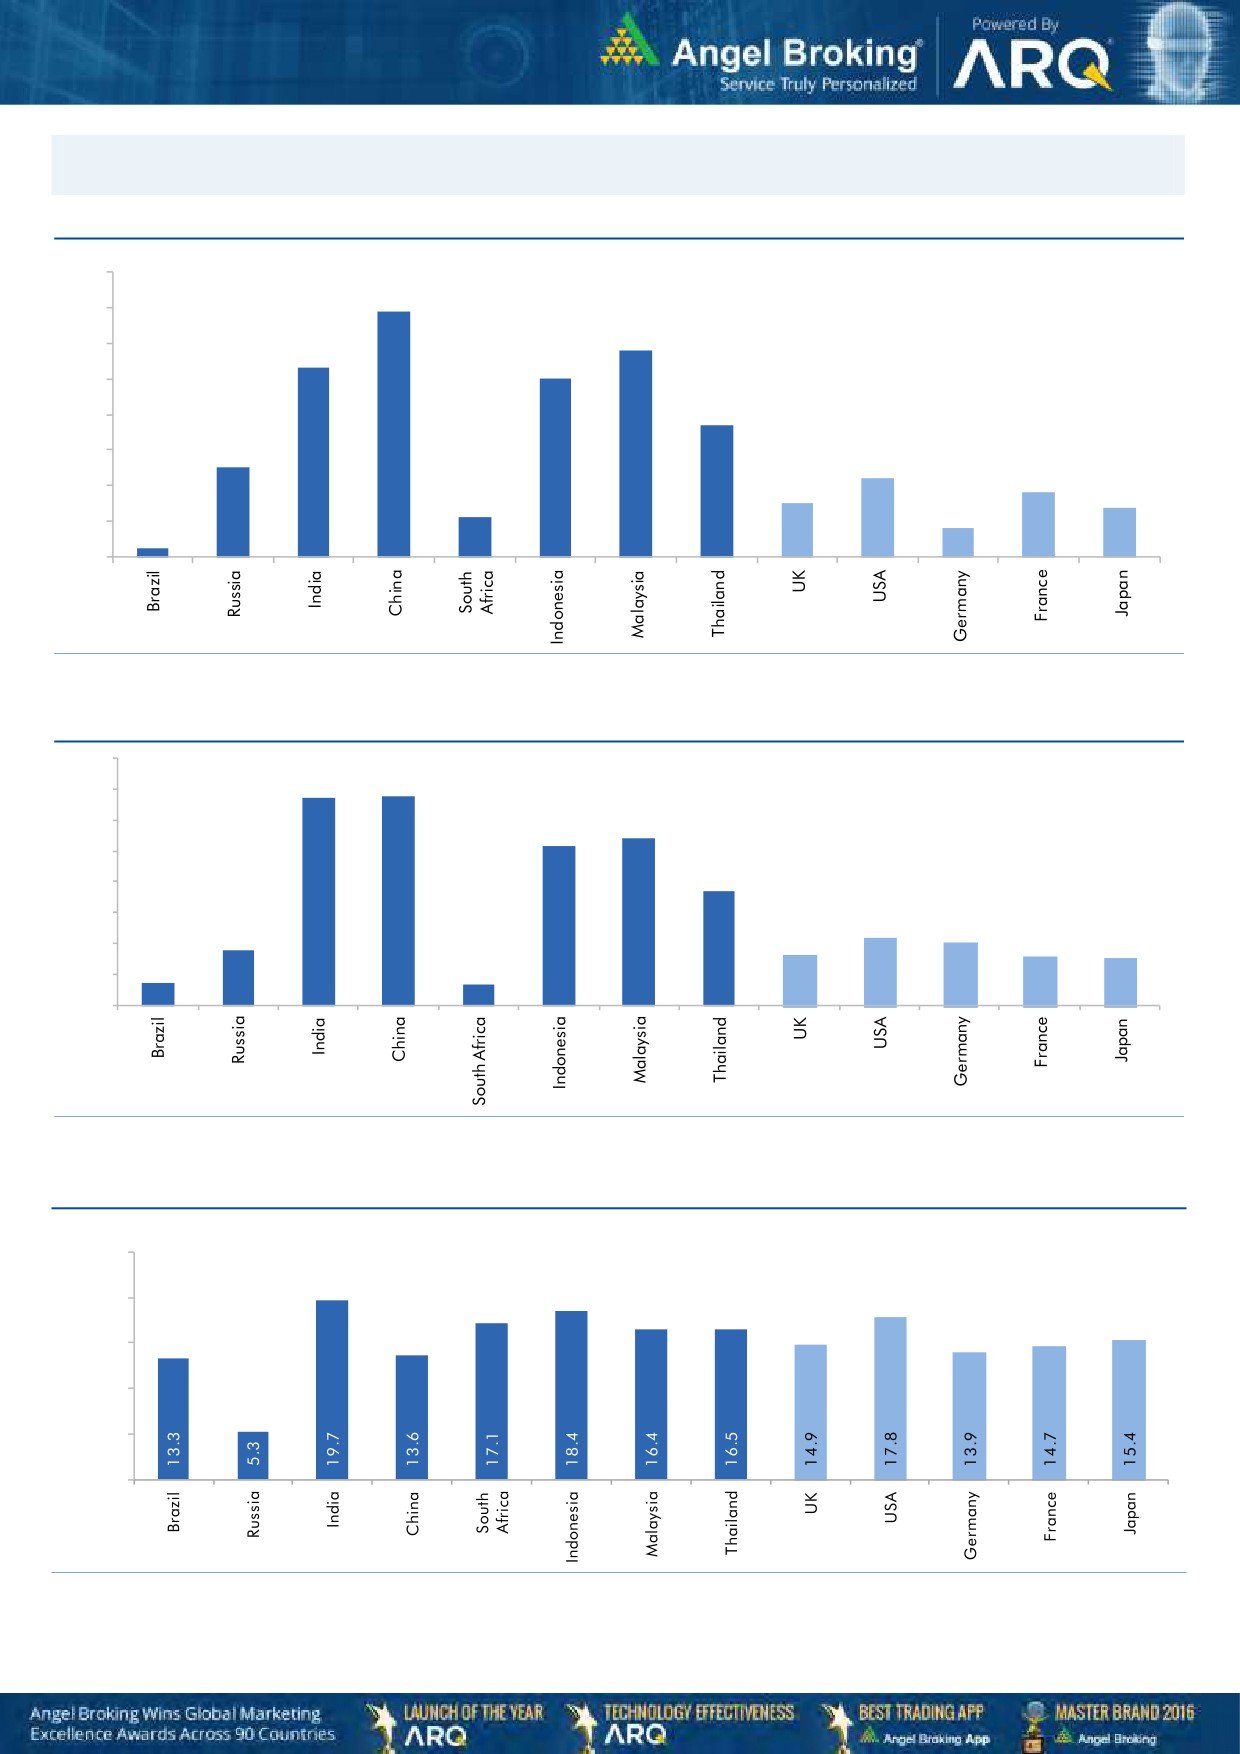
Market Outlook
November 23, 2017
Global watch
Exhibit 1: Latest quarterly GDP Growth (%, yoy) across select developing and developed countries
(%)
8.0
6.9
7.0
5.8
6.0
5.3
5.0
5.0
1.1
3.7
4.0
2.5
3.0
2.2
1.8
2.0
1.5
1.4
0.8
1.0
0.3
-
Source: Bloomberg, Angel Research
Exhibit 2: 2017 GDP Growth projection by IMF (%, yoy) across select developing and developed countries
(%)
6.7
6.8
7.0
6.0
5.4
5.2
5.0
3.7
4.0
3.0
1.8
2.2
2.0
1.7
1.6
2.0
0.7
1.5
0.7
1.0
-
Source: IMF, Angel Research
Exhibit 3: One year forward P-E ratio across select developing and developed countries
(x)
25.0
20.0
15.0
10.0
5.0
-
Source: IMF, Angel Research
Stock Watch
November 23, 2017
Company Name
Reco
CMP
Target
Mkt Cap
Sales ( Čcr )
OPM(%)
EPS (Č)
PER(x)
P/BV(x)
RoE(%)
EV/Sales(x)
(Č)
Price ( Č)
( Č cr )
FY18E FY19E
FY18E
FY19E
FY18E
FY19E
FY18E
FY19E
FY18E
FY19E
FY18E
FY19E
FY18E
FY19E
Agri / Agri Chemical
Rallis
Reduce
230
209
4,474
1,873
2,099
15.0
15.0
9.5
10.5
24.2
21.9
3.7
3.3
15.8
16.0
2.3
2.1
United Phosphorus
Accumulate
747
820
37,959
18,922
21,949
18.0
18.5
36.2
45.6
20.6
16.4
4.3
3.6
22.7
23.8
2.2
1.8
Auto & Auto Ancillary
Ashok Leyland
Accumulate
113
127
33,149
23,339
27,240
10.1
10.8
4.7
6.2
24.4
18.2
4.9
4.3
20.0
23.6
1.4
1.2
Bajaj Auto
Neutral
3,312
-
95,844
23,936
27,955
19.5
20.1
142.7
167.3
23.2
19.8
5.1
4.5
21.8
22.8
3.6
3.0
Bharat Forge
Buy
712
875
33,129
7,637
8,755
21.7
23.2
36.1
47.3
19.7
15.1
3.5
3.0
18.5
20.8
4.2
3.6
Eicher Motors
Neutral
30,178
-
82,153
19,043
22,837
19.5
19.9
835.4
1,019.0
36.1
29.6
13.5
10.4
40.9
37.8
4.2
3.4
Gabriel India
Neutral
192
-
2,753
1,782
2,033
9.7
10.2
7.1
8.9
27.0
21.7
5.5
4.6
21.0
22.2
1.5
1.3
Hero Motocorp
Accumulate
3,662
4,129
73,130
32,239
36,878
16.0
15.6
184.4
206.5
19.9
17.7
6.2
5.5
31.3
30.7
2.1
1.8
Jamna Auto Industries Neutral
60
-
2,391
1,441
1,662
14.4
14.8
13.9
17.6
4.3
3.4
1.2
1.0
30.0
31.0
1.7
1.4
Mahindra and Mahindra Neutral
1,430
-
88,860
46,971
53,816
13.6
14.0
67.7
79.8
21.1
17.9
3.0
2.7
15.0
15.9
1.8
1.5
Maruti
Accumulate
8,514
9,489
257,200
79,470
95,208
15.9
17.2
281.7
363.8
30.2
23.4
6.6
5.3
21.7
22.8
2.9
2.3
Minda Industries
Neutral
1,102
-
9,527
4,328
5,084
11.0
11.9
27.3
36.4
40.5
30.3
8.6
6.7
23.1
25.6
2.3
1.9
Motherson Sumi
Neutral
345
-
72,576
55,937
64,445
10.8
11.4
16.9
21.1
20.4
16.4
4.6
4.7
25.2
25.4
1.4
1.1
Tata Motors
Neutral
428
-
123,651
303,167
343,649
11.8
13.8
33.1
54.7
12.9
7.8
2.1
1.7
16.9
23.0
0.5
0.4
TVS Motor
Neutral
719
-
34,147
13,992
16,216
9.0
9.4
17.1
20.3
42.2
35.4
11.2
8.7
29.7
27.7
2.4
2.0
Amara Raja Batteries
Accumulate
787
858
13,442
6,140
7,122
14.3
15.6
29.3
39.0
26.9
20.2
4.6
3.8
17.1
19.0
2.2
1.9
Exide Industries
Neutral
202
-
17,196
8,689
9,854
15.1
15.2
9.7
11.0
21.0
18.4
3.7
3.3
15.7
16.1
1.7
1.5
Apollo Tyres
Neutral
248
-
14,167
15,739
17,326
13.3
14.6
20.4
26.7
12.1
9.3
1.5
1.3
20.4
26.7
1.1
1.0
Ceat
Neutral
1,834
-
7,420
6,661
7,717
11.1
14.2
116.2
178.2
15.8
10.3
2.7
2.3
15.2
21.3
1.2
1.1
JK Tyres
Neutral
146
-
3,317
8,318
9,239
16.2
16.4
21.0
27.5
7.0
5.3
1.4
1.1
19.1
20.4
0.8
0.7
Swaraj Engines
Neutral
1,891
-
2,349
788
889
16.4
16.5
71.6
81.0
26.4
23.4
7.6
7.1
29.6
31.0
2.6
2.3
Subros
Neutral
251
-
1,506
1,855
2,135
11.6
11.8
10.3
14.7
24.5
17.1
3.7
3.2
15.8
19.1
1.0
0.9
Capital Goods
BEML
Neutral
1,624
-
6,763
4,286
5,194
7.1
8.2
42.9
58.1
37.9
28.0
3.1
2.8
7.6
8.7
1.6
1.3
Bharat Electronics
Neutral
180
-
44,312
10,258
12,470
19.6
19.5
7.3
8.6
24.7
21.0
0.5
0.4
20.4
21.9
3.8
3.1
Voltas
Neutral
623
-
20,619
6,778
8,004
9.6
11.0
17.1
22.4
36.4
27.8
8.7
7.6
17.7
19.8
2.7
2.3
BHEL
Neutral
89
-
32,584
33,200
39,167
6.8
9.5
6.2
11.2
14.3
7.9
0.7
0.6
4.6
8.0
0.6
0.4
Blue Star
Buy
685
867
6,564
5,220
6,207
6.3
6.6
16.8
22.3
40.8
30.7
8.1
7.2
19.9
23.3
1.2
1.0
CG Power and Industrial
Neutral
86
-
5,384
6,555
7,292
7.5
7.5
-
0.8
8,590.0
107.4
1.3
1.3
0.1
1.2
0.9
0.8
Solutions
Greaves Cotton
Neutral
122
-
2,976
1,778
1,993
14.7
15.1
8.1
9.1
15.0
13.4
3.4
3.2
21.8
23.6
1.4
1.3
Stock Watch
November 23, 2017
Company Name
Reco
CMP
Target
Mkt Cap
Sales ( Čcr )
OPM(%)
EPS (Č)
PER(x)
P/BV(x)
RoE(%)
EV/Sales(x)
(Č)
Price ( Č)
( Č cr )
FY18E FY19E
FY18E
FY19E
FY18E
FY19E
FY18E
FY19E
FY18E
FY19E
FY18E
FY19E
FY18E
FY19E
Capital Goods
KEC International
Accumulate
305
350
7,835
9,779
11,113
9.4
9.8
14.2
18.2
21.5
16.7
4.1
3.4
21.1
22.1
1.1
0.9
KEI Industries
Accumulate
333
380
2,607
3,001
3,391
10.0
10.0
13.0
16.1
25.6
20.7
4.7
3.9
18.2
18.7
1.0
0.9
Thermax
Neutral
1,040
-
12,389
4,125
4,747
10.3
10.8
26.7
31.5
38.9
33.0
4.4
4.0
11.2
12.0
2.7
2.4
VATech Wabag
Buy
549
681
2,998
3,867
4,126
9.6
10.0
34.9
39.8
15.7
13.8
2.6
2.2
17.7
17.5
0.8
0.7
Cement
ACC
Neutral
1,724
-
32,368
12,255
13,350
13.5
14.3
58.0
66.2
29.7
26.0
3.5
3.3
11.5
12.2
2.6
2.4
Ambuja Cements
Neutral
266
-
52,769
10,250
11,450
17.5
19.0
7.2
8.3
36.9
32.0
2.6
2.5
7.0
7.8
4.9
4.3
India Cements
Neutral
176
-
5,431
6,135
6,750
14.8
15.2
8.5
11.5
20.7
15.3
1.0
1.0
4.8
6.2
1.2
1.1
JK Cement
Neutral
998
-
6,976
4,150
4,775
19.2
20.0
49.0
63.5
20.4
15.7
3.2
2.8
17.0
18.5
2.1
1.8
J K Lakshmi Cement
Neutral
395
-
4,653
3,422
3,757
15.5
17.0
13.5
23.2
29.3
17.0
3.0
2.6
10.8
15.5
1.8
1.5
Orient Cement
Neutral
163
-
3,344
2,215
3,233
16.8
17.0
5.9
6.9
27.7
23.7
2.1
2.0
10.8
10.1
2.5
1.7
UltraTech Cement
Neutral
4,225
-
115,989
28,250
35,150
20.2
23.5
77.5
122.2
54.5
34.6
4.6
4.2
9.6
14.8
4.6
3.7
Construction
KNR Constructions
Neutral
271
-
3,810
1,846
2,203
14.5
14.5
12.1
13.7
22.4
19.9
1.2
1.1
17.5
16.7
2.1
1.8
Larsen & Toubro
Neutral
1,221
-
171,101
95,787
109,476
10.2
11.6
44.5
50.8
27.5
24.1
3.4
3.2
12.9
13.1
2.3
2.1
Gujarat Pipavav Port
Neutral
150
-
7,269
739
842
61.6
62.7
5.1
6.2
29.5
24.5
3.7
3.6
12.7
14.9
9.3
8.0
PNC Infratech
Neutral
183
-
4,702
2,040
2,935
13.0
13.0
6.4
9.0
28.6
20.4
0.7
0.7
9.7
12.2
2.3
1.7
Simplex Infra
Neutral
558
-
2,762
6,012
6,619
11.6
11.7
21.1
31.0
26.5
18.0
1.8
1.7
6.5
8.6
1.0
0.9
Sadbhav Engineering
Neutral
354
-
6,070
3,823
4,426
10.7
10.8
10.3
11.8
34.4
30.0
4.1
3.6
10.1
10.5
1.9
1.7
NBCC
Neutral
268
-
24,129
9,099
12,706
6.4
6.4
7.3
9.6
36.8
28.0
1.6
1.3
27.5
30.5
2.5
1.8
MEP Infra
Neutral
100
-
1,624
2,403
2,910
18.3
16.8
2.4
6.1
42.5
16.4
16.1
10.9
35.2
55.8
1.8
1.5
SIPL
Neutral
137
-
4,825
2,060
2,390
46.8
47.7
(5.8)
(3.1)
5.1
5.9
(14.2)
(2.3)
7.1
6.6
Engineers India
Neutral
182
-
12,248
1,795
2,611
21.1
22.4
5.9
8.1
30.8
22.4
2.2
2.1
12.9
16.1
5.2
3.4
Financials
Axis Bank
Accumulate
540
580
129,510
32,558
35,843
3.5
3.2
27.8
41.0
19.4
13.2
2.1
1.8
11.4
14.9
-
-
Bank of Baroda
Neutral
181
-
41,602
22,533
26,079
2.4
2.4
12.0
20.9
15.0
8.6
1.0
0.9
6.6
11.0
-
-
Canara Bank
Neutral
399
-
23,817
17,925
20,235
2.0
2.1
18.5
36.5
21.6
10.9
0.8
0.8
3.4
6.2
-
-
Can Fin Homes
Neutral
465
-
6,183
586
741
3.5
3.5
107.8
141.0
4.3
3.3
1.0
0.8
24.1
25.6
-
-
Cholamandalam Inv. &
Neutral
1,275
-
19,928
2,826
3,307
6.3
6.3
53.7
64.6
23.8
19.8
4.0
3.5
18.3
18.9
-
-
Fin. Co.
Dewan Housing Finance Accumulate
620
712
19,456
2,676
3,383
2.4
2.7
37.4
49.7
16.6
12.5
2.2
1.9
13.8
16.2
-
-
Equitas Holdings
Buy
145
235
4,928
1,125
1,380
9.6
9.8
1.5
6.0
96.8
24.2
2.2
2.0
2.4
8.2
-
-
Federal Bank
Accumulate
113
125
22,182
4,896
5,930
2.8
3.1
5.4
7.6
21.1
14.9
1.8
1.6
8.5
11.0
-
-
Stock Watch
November 23, 2017
Company Name
Reco
CMP
Target
Mkt Cap
Sales ( Čcr )
OPM(%)
EPS (Č)
PER(x)
P/BV(x)
RoE(%)
EV/Sales(x)
(Č)
Price ( Č)
( Č cr )
FY18E FY19E
FY18E
FY19E
FY18E
FY19E
FY18E
FY19E
FY18E
FY19E
FY18E
FY19E
FY18E
FY19E
Financials
GIC Housing
Buy
425
655
2,288
376
477
3.6
3.7
33.0
40.0
12.9
10.6
2.3
2.0
20.0
23.0
-
-
HDFC Bank
Neutral
1,854
-
479,454
55,236
63,253
4.5
4.4
68.9
82.4
26.9
22.5
4.7
3.9
18.7
18.5
-
-
ICICI Bank
Neutral
319
-
204,705
42,361
51,378
3.6
3.9
18.4
25.7
17.4
12.4
1.9
1.8
11.3
15.0
-
-
Karur Vysya Bank
Buy
121
180
7,324
3,289
3,630
3.7
3.9
10.8
14.1
11.2
8.6
1.3
1.2
12.5
14.7
-
-
LIC Housing Finance
Accumulate
598
630
30,197
4,895
6,332
3.4
3.7
50.7
66.8
11.8
9.0
2.4
1.9
21.7
23.8
-
-
Punjab Natl.Bank
Neutral
189
-
40,272
23,708
25,758
2.1
2.1
5.9
16.4
32.2
11.5
1.0
0.9
3.0
8.3
-
-
RBL Bank
Neutral
507
-
21,104
2,309
2,888
2.6
2.5
16.4
19.1
31.0
26.6
3.9
3.5
13.3
13.8
-
-
Repco Home Finance
Buy
618
825
3,866
496
597
4.4
4.2
38.5
48.7
16.1
12.7
2.9
2.4
19.6
20.6
-
-
South Ind.Bank
Neutral
31
-
5,634
3,195
3,567
3.0
3.1
3.0
3.8
10.3
8.1
1.0
0.9
10.5
11.9
-
-
St Bk of India
Neutral
335
-
289,346
105,827
121,056
2.4
2.5
16.1
25.6
20.8
13.1
1.6
1.5
6.6
9.9
-
-
Union Bank
Neutral
170
-
12,328
14,650
16,225
2.3
2.3
23.1
32.5
7.4
5.2
0.6
0.5
7.1
9.2
-
-
Yes Bank
Neutral
310
-
71,083
11,088
13,138
3.0
2.9
84.0
99.3
3.7
3.1
0.6
0.5
16.3
16.8
-
-
FMCG
Akzo Nobel India
Neutral
1,782
-
8,548
3,164
3,607
13.8
13.7
58.6
67.9
30.4
26.2
7.5
6.6
24.5
25.1
2.6
2.2
Asian Paints
Neutral
1,174
-
112,643
17,603
20,615
18.6
18.6
2,128.9
2,543.3
0.6
0.5
11.6
9.8
28.0
28.9
6.2
5.2
Britannia
Neutral
4,770
-
57,269
9,690
11,278
14.8
15.4
84.0
101.0
56.8
47.2
20.7
16.5
40.6
39.0
5.9
5.0
Colgate
Neutral
1,037
-
28,214
4,420
5,074
24.9
25.3
28.6
32.8
36.3
31.6
14.3
11.6
43.8
40.5
6.1
5.3
Dabur India
Neutral
338
-
59,522
8,346
9,344
19.6
19.9
7.8
9.0
43.3
37.5
8.7
7.9
25.2
24.8
6.7
5.9
GlaxoSmith Con*
Neutral
6,003
-
25,245
5,072
5,760
18.2
18.4
176.3
199.2
34.1
30.1
7.2
6.5
21.2
21.7
4.3
3.7
Godrej Consumer
Neutral
954
-
64,975
10,171
11,682
20.8
21.5
21.7
27.1
44.0
35.2
9.9
8.5
22.3
23.4
6.5
5.6
HUL
Neutral
1,270
-
274,932
37,077
41,508
20.3
21.8
5,189.9
6,318.5
0.2
0.2
38.7
33.1
74.8
82.0
7.3
6.5
ITC
Neutral
258
-
314,508
44,588
49,853
37.0
37.3
9.6
11.0
26.9
23.5
6.6
6.3
25.1
27.3
6.5
5.8
Marico
Neutral
302
-
39,020
6,788
7,766
18.5
19.2
7.1
8.5
42.6
35.6
14.9
12.8
36.9
38.0
5.6
4.9
Nestle*
Neutral
7,624
-
73,505
10,083
11,182
20.0
20.9
119.7
141.3
63.7
54.0
224.5
205.2
36.7
39.8
7.0
6.2
Tata Global
Neutral
274
-
17,296
7,121
7,641
11.9
12.3
6.9
8.0
39.7
34.3
2.7
2.5
6.8
7.2
2.2
2.1
Procter & Gamble
Neutral
9,220
-
29,929
3,034
3,579
27.1
27.7
167.7
198.8
55.0
46.4
14.8
12.7
28.8
29.5
9.3
7.8
Hygiene
IT
HCL Tech^
Buy
841
1,014
120,053
50,009
54,608
22.1
22.1
62.8
67.6
13.4
12.5
3.0
2.6
22.4
20.6
2.1
1.8
Infosys
Buy
966
1,120
221,958
70,333
75,960
26.0
26.0
61.7
65.9
15.7
14.7
3.0
2.8
18.9
18.7
2.5
2.3
TCS
Reduce
2,683
2,442
513,642
123,384
134,488
26.1
26.1
133.2
143.7
20.1
18.7
5.6
5.2
27.6
27.8
3.8
3.5
Tech Mahindra
Accumulate
483
526
47,150
30,545
32,988
15.0
15.0
35.2
37.6
13.7
12.8
2.3
2.2
16.8
16.2
1.3
1.1
Stock Watch
November 23, 2017
Company Name
Reco
CMP
Target
Mkt Cap
Sales ( Čcr )
OPM(%)
EPS (Č)
PER(x)
P/BV(x)
RoE(%)
EV/Sales(x)
(Č)
Price ( Č)
( Č cr )
FY18E FY19E
FY18E
FY19E
FY18E
FY19E
FY18E
FY19E
FY18E
FY19E
FY18E
FY19E
FY18E
FY19E
IT
Wipro
Neutral
294
-
143,154
54,164
56,544
22.3
22.3
18.8
19.5
15.7
15.1
2.5
2.2
15.0
13.6
1.9
1.6
Media
D B Corp
Neutral
361
-
6,642
2,404
2,625
30.5
31.5
23.7
26.9
15.2
13.4
3.6
3.1
23.5
22.8
2.6
2.4
HT Media
Neutral
100
-
2,330
2,589
2,830
15.1
15.4
8.3
10.9
12.1
9.2
1.0
0.9
8.4
10.4
0.4
0.3
Jagran Prakashan
Buy
167
225
5,204
2,541
2,835
28.5
28.7
12.7
14.1
13.2
11.9
2.7
2.4
21.3
21.4
1.9
1.6
Sun TV Network
Neutral
874
-
34,435
3,238
3,789
51.9
55.1
30.9
38.0
28.3
23.0
8.1
7.1
30.0
31.0
10.1
8.6
Hindustan Media
Neutral
244
-
1,792
1,002
1,074
23.3
23.5
29.2
33.8
8.4
7.2
1.3
1.1
15.6
15.4
0.8
0.5
Ventures
TV Today Network
Buy
375
435
2,238
667
727
27.7
27.7
18.6
20.1
20.2
18.7
3.1
3.2
15.6
17.3
2.9
2.7
Music Broadcast Limited Buy
371
434
2,117
271
317
91.0
109.0
6.0
10.0
61.8
37.1
3.9
3.5
6.5
9.3
7.4
6.1
Metals & Mining
Coal India
Neutral
272
-
169,028
82,301
91,235
17.0
18.0
17.1
20.5
15.9
13.3
3.0
2.8
45.0
55.0
1.7
1.5
Hind. Zinc
Neutral
313
-
132,337
22,108
24,555
57.0
58.0
22.1
26.3
14.2
11.9
4.6
3.7
32.0
35.0
5.0
4.2
Hindalco
Neutral
258
-
57,982
102,350
105,355
13.5
14.5
21.5
24.5
12.0
10.5
1.7
1.4
15.0
15.2
1.1
1.1
JSW Steel
Neutral
268
-
64,830
64,500
68,245
21.1
21.5
20.1
21.2
13.3
12.7
2.4
2.1
-
-
1.7
1.7
NMDC
Neutral
126
-
39,786
10,209
11,450
47.0
48.0
11.1
12.1
11.3
10.4
1.6
1.5
-
-
3.4
3.1
SAIL
Neutral
82
-
33,722
54,100
63,555
3.0
10.0
(10.0)
1.5
54.4
1.1
1.1
-
-
1.6
1.4
Vedanta
Neutral
309
-
115,029
81,206
87,345
28.0
29.0
26.5
33.5
11.7
9.2
2.7
2.3
-
-
2.2
1.9
Tata Steel
Neutral
712
-
69,112
121,445
126,500
16.2
17.2
65.4
81.3
10.9
8.8
1.7
1.5
-
-
1.1
1.0
Oil & Gas
GAIL
Neutral
467
-
79,052
53,115
52,344
14.2
15.3
30.0
31.1
15.6
15.0
2.0
1.8
-
-
1.2
1.2
ONGC
Neutral
181
-
231,961
83,111
84,934
44.2
44.9
16.4
16.9
11.0
10.7
1.3
1.2
-
-
2.7
2.6
Indian Oil Corp
Neutral
396
-
192,124
396,116
432,560
8.5
8.8
40.1
42.2
9.9
9.4
1.7
1.5
-
-
0.6
0.6
Reliance Industries
Neutral
930
-
605,016
257,711
267,438
17.0
18.2
89.1
89.5
10.4
10.4
1.0
0.9
-
-
2.0
1.9
Pharmaceuticals
Alembic Pharma
Buy
511
600
9,640
3,346
3,915
19.6
19.2
21.0
23.9
24.4
21.4
4.3
3.7
19.1
18.4
2.9
2.5
Alkem Laboratories Ltd
Accumulate
1,946
2,125
23,267
6,320
7,341
17.5
19.8
72.7
96.6
26.8
20.2
4.7
4.0
16.7
18.7
3.6
3.1
Aurobindo Pharma
Buy
699
823
40,941
17,086
19,478
22.1
22.0
44.7
51.4
15.6
13.6
3.5
2.8
24.7
22.7
2.5
2.2
Aventis*
Neutral
4,434
-
10,212
2,411
2,698
18.8
18.8
151.6
163.9
29.3
27.1
4.5
3.7
25.4
27.5
3.8
3.2
Cadila Healthcare
Neutral
443
-
45,321
11,584
13,228
20.3
20.4
18.7
21.3
23.7
20.8
5.3
4.3
24.6
22.9
3.7
3.2
Cipla
Sell
619
462
49,806
16,163
18,711
16.6
16.9
20.7
24.3
29.9
25.5
3.6
3.2
12.6
13.1
3.2
2.7
Dr Reddy's
Neutral
2,361
-
39,156
15,844
17,973
17.6
18.2
91.7
111.0
25.8
21.3
2.9
2.6
11.9
13.0
2.7
2.4
GSK Pharma*
Neutral
2,496
-
21,139
2,968
3,324
13.8
15.9
37.8
46.3
66.0
53.9
11.5
12.7
16.7
22.4
6.9
6.3
Indoco Remedies
Sell
280
153
2,579
1,154
1,310
14.9
14.9
11.3
12.7
24.8
22.0
3.5
3.1
15.0
15.0
2.4
2.0
Stock Watch
November 23, 2017
Company Name
Reco
CMP
Target
Mkt Cap
Sales ( Čcr )
OPM(%)
EPS (Č)
PER(x)
P/BV(x)
RoE(%)
EV/Sales(x)
(Č)
Price ( Č)
( Č cr )
FY18E FY19E
FY18E
FY19E
FY18E
FY19E
FY18E
FY19E
FY18E
FY19E
FY18E
FY19E
FY18E
FY19E
Pharmaceuticals
Ipca labs
Neutral
535
-
6,755
3,593
4,022
14.5
15.5
19.4
25.2
27.6
21.2
2.5
2.3
9.5
11.2
1.9
1.7
Lupin
Buy
828
1,091
37,418
16,240
18,562
21.3
21.7
42.5
49.6
19.5
16.7
2.4
2.2
13.3
13.7
2.4
2.0
Natco Pharma
Buy
907
1,057
15,828
1,886
2,016
32.3
29.5
23.2
22.0
39.2
41.2
8.2
7.3
20.9
17.6
8.2
7.7
Sun Pharma
Neutral
535
-
128,408
32,899
36,451
26.9
25.4
31.6
32.3
16.9
16.6
3.0
2.6
18.7
18.8
3.5
3.0
Syngene International
Accumulate
523
556
10,452
1,394
1,818
33.0
36.0
15.8
20.6
33.0
25.4
6.2
5.1
18.6
20.0
7.5
5.7
Power
Tata Power
Neutral
93
-
25,168
32,547
33,806
20.5
20.5
4.7
5.4
19.8
17.4
1.9
1.6
10.5
10.5
1.8
1.7
NTPC
Neutral
182
-
149,820
86,070
101,246
28.3
30.7
12.9
16.2
14.1
11.2
1.5
1.3
10.6
12.4
3.1
2.8
Power Grid
Accumulate
207
223
108,320
29,183
32,946
89.7
90.0
18.0
20.8
11.5
10.0
1.9
1.7
17.7
18.2
7.6
7.1
Real Estate
Prestige Estate
Neutral
319
-
11,976
4,607
5,146
21.0
22.2
7.9
9.8
40.4
32.6
2.5
2.3
10.3
12.0
3.8
3.4
MLIFE
Buy
449
522
2,305
487
590
12.3
17.8
21.0
31.2
21.4
14.4
1.1
1.1
5.2
7.4
3.4
2.8
Telecom
Bharti Airtel
Neutral
499
-
199,350
97,903
105,233
36.0
36.3
9.3
11.1
53.6
45.1
2.6
2.5
5.0
5.6
3.0
2.7
Idea Cellular
Neutral
99
-
35,568
35,012
37,689
27.1
27.7
(4.4)
(2.7)
1.5
1.6
(6.8)
(4.6)
2.3
2.1
zOthers
Abbott India
Neutral
4,987
-
10,596
3,244
3,723
14.9
16.1
167.5
209.4
29.8
23.8
6.6
5.5
23.7
24.8
2.9
2.5
Asian Granito
Buy
489
570
1,472
1,169
1,286
12.5
12.5
16.0
19.7
30.6
24.8
3.3
2.9
10.7
11.6
1.5
1.3
Bajaj Electricals
Neutral
414
-
4,206
4,646
5,301
6.7
7.6
16.1
22.3
25.7
18.6
4.2
3.6
16.4
19.2
0.9
0.8
Banco Products (India)
Neutral
227
-
1,626
1,530
1,695
13.2
12.7
19.0
20.0
12.0
11.4
1.9
1.7
0.2
0.2
1.0
108.2
Coffee Day Enterprises
Neutral
228
-
4,699
3,494
3,913
17.4
18.0
4.8
5.7
-
40.0
2.0
1.9
-
0.1
1.8
1.6
Ltd
Elecon Engineering
Neutral
79
-
886
171
201
15.0
16.2
36.0
43.0
2.2
1.8
0.2
0.2
0.1
0.1
4.6
3.9
Garware Wall Ropes
Neutral
931
-
2,037
928
1,003
15.2
15.2
39.4
43.2
23.6
21.6
3.9
3.3
16.5
15.4
2.1
1.8
Goodyear India*
Neutral
832
-
1,919
1,717
1,866
11.8
12.3
47.9
49.8
17.4
16.7
2.7
2.3
15.6
15.7
0.8
116.4
Hitachi
Neutral
2,485
-
6,757
2,355
2,715
10.3
10.8
49.0
60.9
50.7
40.8
11.9
9.4
0.2
0.2
2.9
2.5
HSIL
Neutral
491
-
3,549
2,240
2,670
14.6
15.0
17.0
22.0
28.9
22.3
2.4
2.3
0.1
0.1
1.8
1.5
Interglobe Aviation
Neutral
1,165
-
44,771
22,570
27,955
14.2
15.0
63.6
81.8
18.3
14.3
9.6
8.1
0.5
0.6
1.7
1.3
Jyothy Laboratories
Neutral
368
-
6,681
1,781
2,044
14.1
15.0
9.4
10.5
39.3
35.0
8.4
7.9
0.2
0.2
4.0
3.4
Linc Pen & Plastics
Neutral
283
-
418
420
462
9.3
9.3
15.3
17.1
18.5
16.5
3.1
3.2
16.9
19.5
1.0
1.0
M M Forgings
Neutral
897
-
1,083
542
642
20.1
21.0
41.6
56.8
21.6
15.8
3.0
2.5
0.1
0.2
2.4
2.1
Mirza International
Neutral
162
-
1,948
1,148
1,285
18.0
18.0
8.0
9.4
20.2
17.3
3.3
2.8
16.3
16.1
1.9
1.6
Navkar Corporation
Buy
189
265
2,837
561
617
41.5
41.5
11.5
12.7
16.4
14.8
1.7
1.5
10.5
10.4
5.7
5.0
Nilkamal
Neutral
1,605
-
2,395
2,317
2,525
11.4
11.1
96.0
105.0
16.7
15.3
2.8
2.5
0.2
0.2
1.0
0.9
Stock Watch
November 23, 2017
Company Name
Reco
CMP
Target Mkt Cap
Sales ( Čcr )
OPM(%)
EPS (Č)
PER(x)
P/BV(x)
RoE(%)
EV/Sales(x)
(Č)
Price ( Č)
( Č cr )
FY18E FY19E FY18E FY19E FY18E FY19E FY18E FY19E FY18E FY19E FY18E FY19E FY18E FY19E
zOthers
Parag Milk Foods
Neutral
241
-
2,023
1,987
2,379
7.6
9.0
12.4
18.3
19.4
13.1
2.7
2.4
8.2
13.2
1.1
1.0
Radico Khaitan
Neutral
298
-
3,964
1,811
1,992
13.2
13.2
8.1
8.8
36.7
33.8
3.7
4.1
10.1
12.0
2.5
2.3
Relaxo Footwears
Neutral
612
-
7,370
1,981
2,310
13.7
14.5
12.0
15.5
51.0
39.5
9.9
8.0
0.2
0.2
3.8
3.2
Siyaram Silk Mills
Accumulate
578
650
2,707
1,769
1,981
12.7
12.7
22.6
26.2
25.5
22.0
4.0
3.4
15.5
15.5
1.7
1.5
Styrolution ABS India* Neutral
918
-
1,614
1,800
1,980
8.0
8.1
42.0
46.2
21.9
19.9
2.5
2.2
0.1
0.1
1.0
0.9
Surya Roshni
Neutral
372
-
1,631
4,870
5,320
7.7
7.8
22.8
28.1
16.4
13.2
2.2
1.9
0.1
0.1
0.6
0.5
TVS Srichakra
Neutral
3,302
-
2,528
2,729
2,893
12.7
12.5
248.5
265.0
13.3
12.5
3.8
3.1
0.3
0.3
0.9
0.9
Visaka Industries
Neutral
644
-
1,023
1,104
1,214
12.1
12.6
31.0
37.9
20.8
17.0
2.5
2.3
0.1
0.1
1.2
1.0
VIP Industries
Neutral
346
-
4,889
1,450
1,693
10.4
10.5
6.5
7.8
52.9
44.3
11.2
9.8
21.1
22.1
3.4
2.9
Navin Fluorine
Neutral
704
-
3,473
945
1,154
22.4
22.6
28.7
34.8
24.5
20.3
4.1
3.5
-
-
3.2
2.5
Source: Company, Angel Research; Note: *December year end; #September year end; &October year end; Price as on November 22, 2017
Market Outlook
November 23, 2017
Research Team Tel: 022 - 39357800
DISCLAIMER
Angel Broking Private Limited (hereinafter referred to as “Angel”) is a registered Member of National Stock Exchange of India
Limited,Bombay Stock Exchange Limited and Metropolitan Stock Exchange Limited. It is also registered as a Depository Participant with
CDSL and Portfolio Manager with SEBI. It also has registration with AMFI as a Mutual Fund Distributor. Angel Broking Private Limited is a
registered entity with SEBI for Research Analyst in terms of SEBI (Research Analyst) Regulations, 2014 vide registration number
INH000000164. Angel or its associates has not been debarred/ suspended by SEBI or any other regulatory authority for accessing
/dealing in securities Market. Angel or its associates/analyst has not received any compensation / managed or
co-managed public offering of securities of the company covered by Analyst during the past twelve months.
This document is solely for the personal information of the recipient, and must not be singularly used as the basis of any investment
decision. Nothing in this document should be construed as investment or financial advice. Each recipient of this document should make
such investigations as they deem necessary to arrive at an independent evaluation of an investment in the securities of the companies
referred to in this document (including the merits and risks involved), and should consult their own advisors to determine the merits and
risks of such an investment.
Reports based on technical and derivative analysis center on studying charts of a stock's price movement, outstanding positions and
trading volume, as opposed to focusing on a company's fundamentals and, as such, may not match with a report on a company's
fundamentals. Investors are advised to refer the Fundamental and Technical Research Reports available on our website to evaluate the
contrary view, if any.
The information in this document has been printed on the basis of publicly available information, internal data and other reliable
sources believed to be true, but we do not represent that it is accurate or complete and it should not be relied on as such, as this
document is for general guidance only. Angel Broking Pvt. Limited or any of its affiliates/ group companies shall not be in any way
responsible for any loss or damage that may arise to any person from any inadvertent error in the information contained in this report.
Angel Broking Pvt. Limited has not independently verified all the information contained within this document. Accordingly, we cannot
testify, nor make any representation or warranty, express or implied, to the accuracy, contents or data contained within this document.
While Angel Broking Pvt. Limited endeavors to update on a reasonable basis the information discussed in this material, there may be
regulatory, compliance, or other reasons that prevent us from doing so.
This document is being supplied to you solely for your information, and its contents, information or data may not be reproduced,
redistributed or passed on, directly or indirectly.
Neither Angel Broking Pvt. Limited, nor its directors, employees or affiliates shall be liable for any loss or damage that may arise from
or in connection with the use of this information.